Analisis_Geoespacial
Análisis Geoespacial
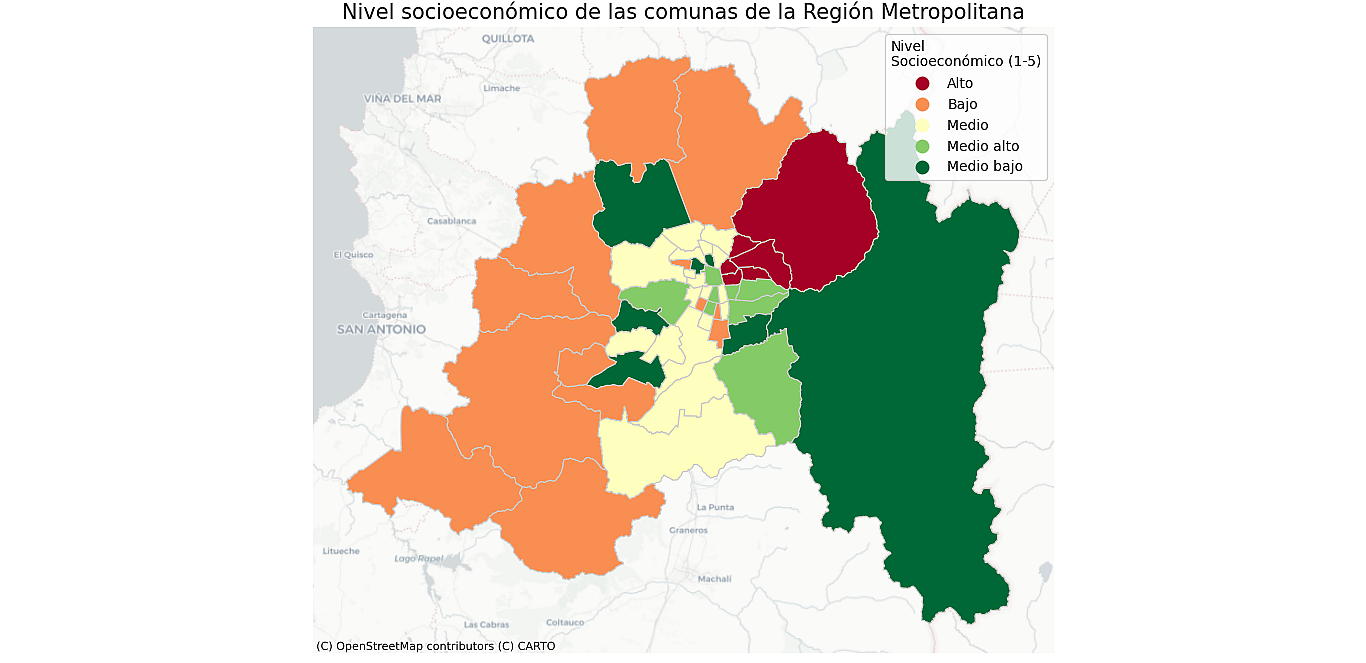
Región Metropolitana de Chile: Comunas por nivel socioeconómico
Análisis mediante Python y Geopandas
Código Python
Establecer el directorio de trabajo
import os

os.chdir('work directory')
Importar bibliotecas
import pandas as pd

import geopandas as gpd

import matplotlib.pyplot as plt
Importar el shapefile
gdf = gpd.read_file('comunas.shp')
gdf
Mostrar información sobre el shapefile importado
print(f"{type(gdf)}, {gdf.geometry.name}")   # Displays the name of the 'geometry' column in the shapefile

print(gdf.head())

print(gdf.geometry.geom_type.value_counts())
Importar los datos estadísticos para desplegar en el mapa
df = pd.read_csv('data.csv')

df
Crear un geodataframe (gdf) uniendo el shapefile y el archivo de datos CSV
full = gdf.merge(df, left_on="CUT", right_on="id_comuna")
Graficar la variable grupo socioeconómico (GSE) en un mapa
Cada uno de sus niveles será mostrado con un color diferente
colors = 5            # La variable a desplegar (GSE) posee 5 categorías
cmap = 'Blues'
figsize = (16, 10)
title = 'Metropolitan Region of Chile: comunas by Socioeconomic level, 2025'

full.plot(column='GSE', cmap=cmap, figsize=figsize, k=colors, legend=True, aspect=1)
plt.title(title, fontdict={'fontsize': 18}, loc='center')

plt.show()